Research a topic of personal interest to collect quantitative data. Select the appropriate data visualizations and design the user interface. Finally, prototype the motion and micro-interactions to show and hide the layers of information.
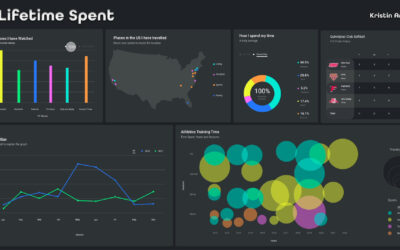
Research a topic of personal interest to collect quantitative data. Select the appropriate data visualizations and design the user interface. Finally, prototype the motion and micro-interactions to show and hide the layers of information.
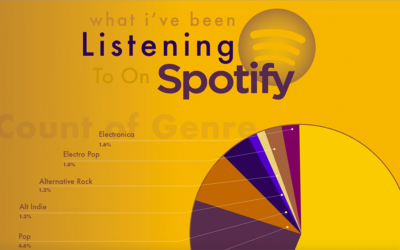
You are more than a number, but select something from your life to collect data about over the course of several weeks. Translate that data into an interactive infographic that reveals detailed layered information.
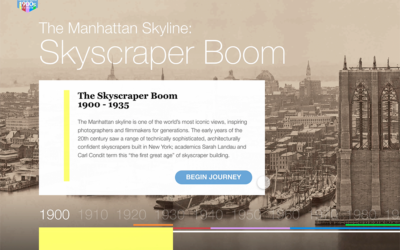
Research a topic, develop three user flows, and design an interface of an interactive timeline that the user would…
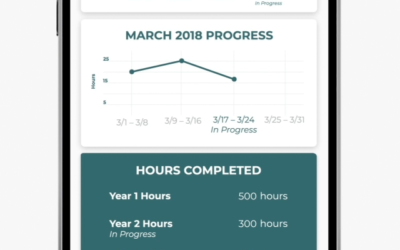
Fake it until you make it or prototype it until you develop it. Create a seamless user experience exemplified through a…